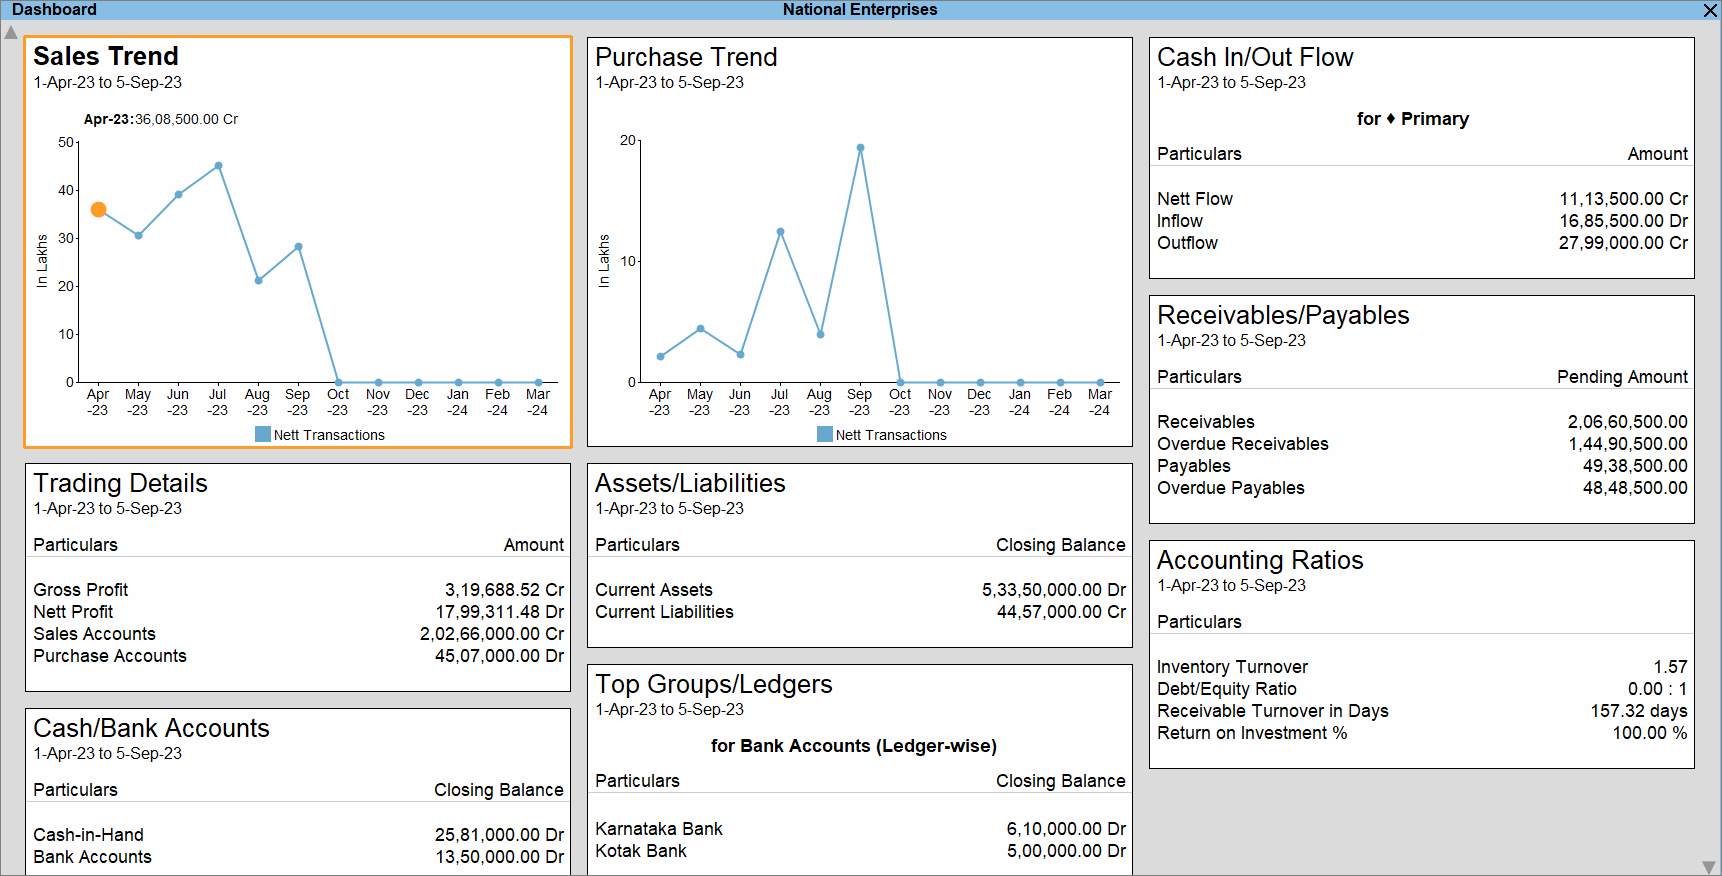
Dashboard in TallyPrime opens with the default set of tiles – Sales Trend, Purchase Trend, Trading Details, Assets/Liabilities, Cash/Bank Accounts, Cash In/Out Flow, Receivables/Payables, Top Groups/Ledgers, and Accounting Ratios. These tiles provide you with an overview of your Company’s financial health.
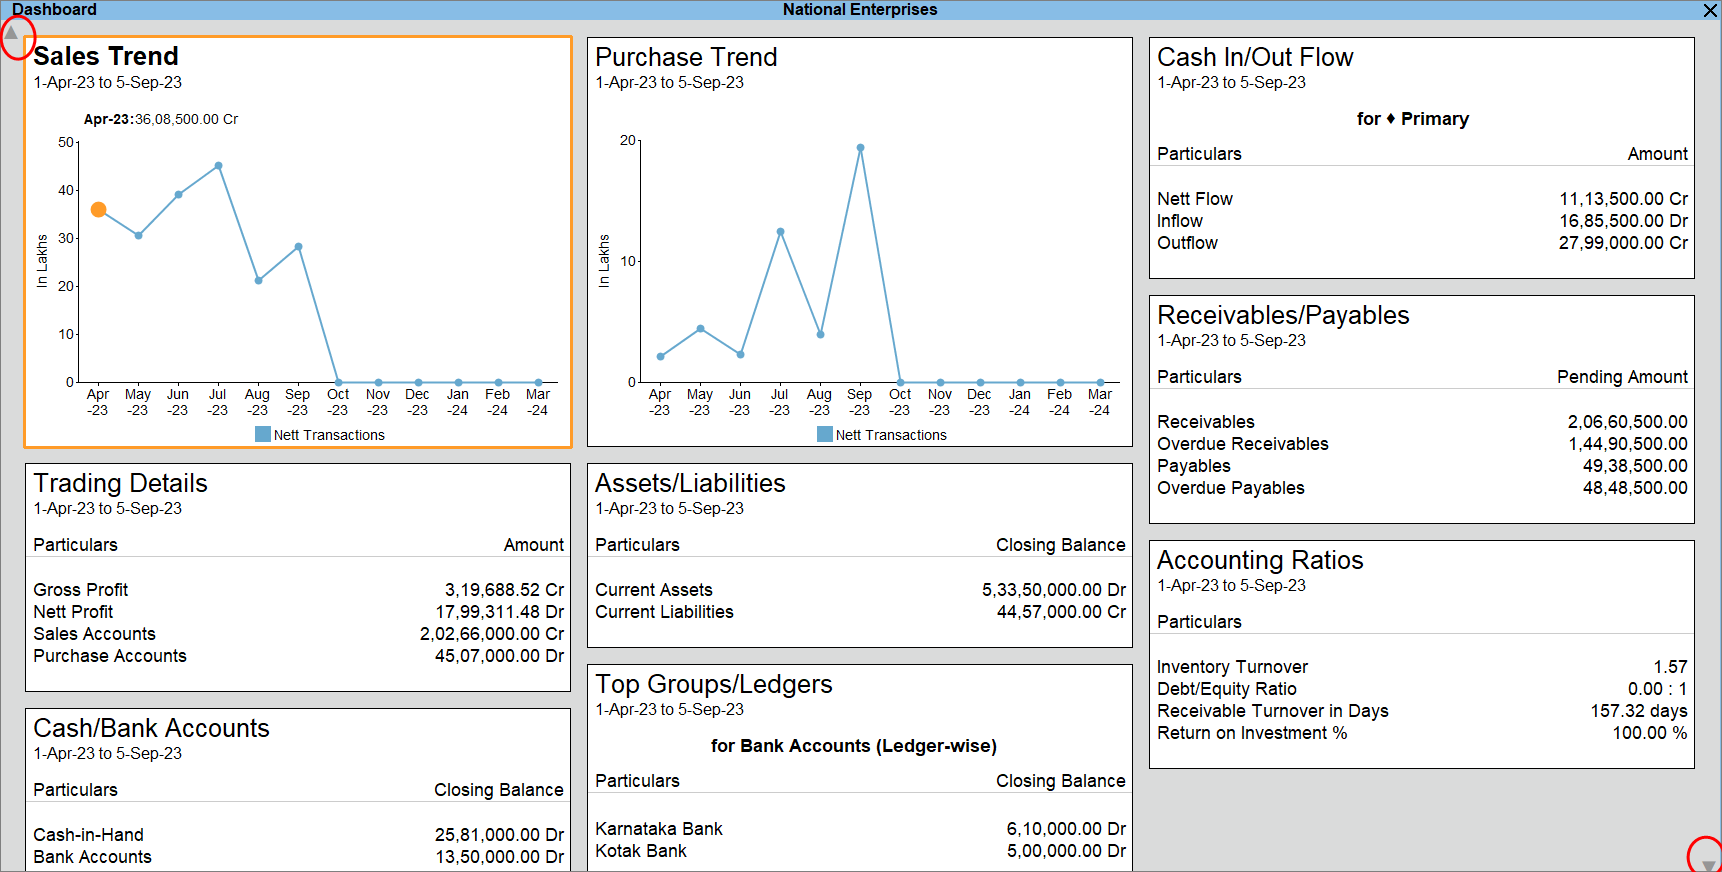
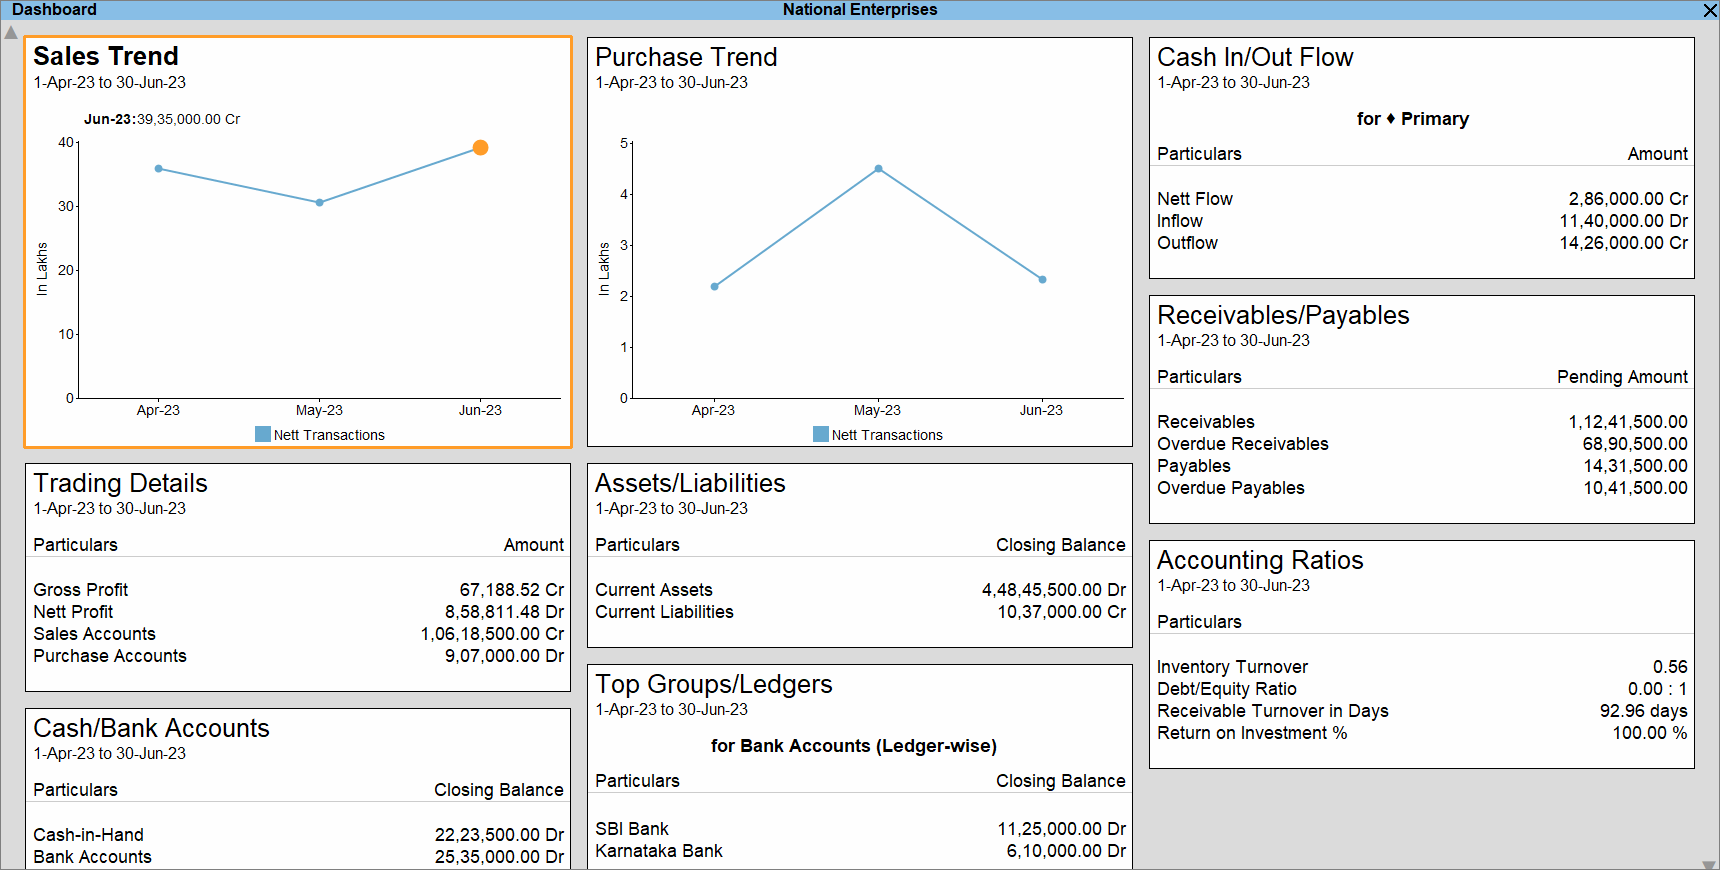
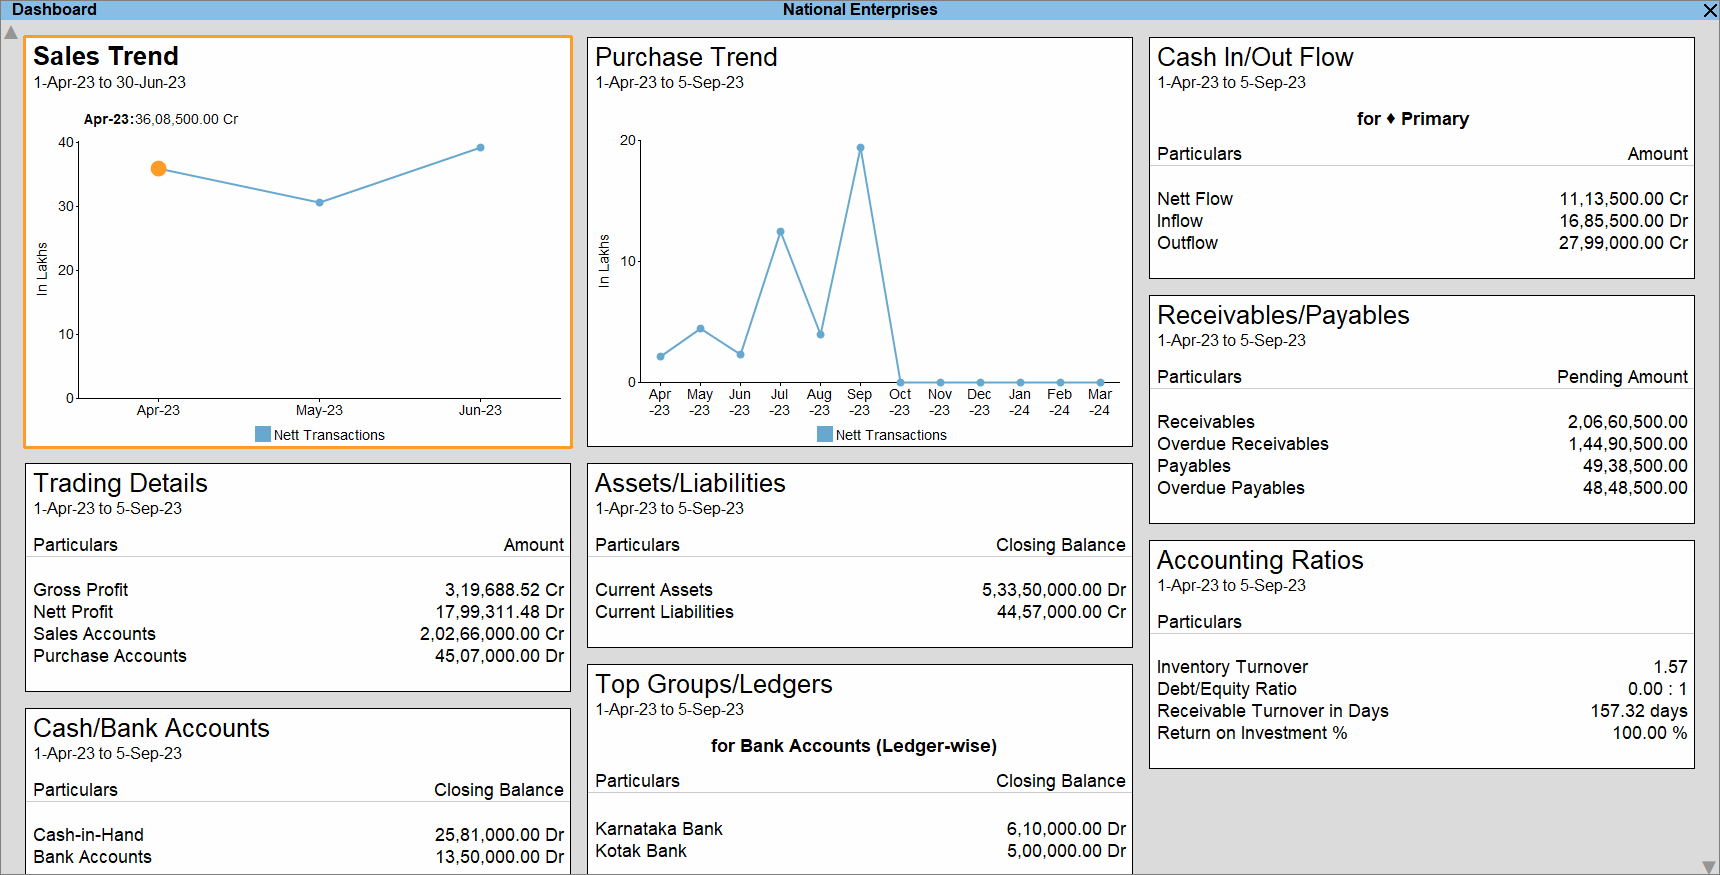
You can easily view the Dashboard for any Period and also change the Period for specific tiles. If you add tiles to the Dashboard in TallyPrime, you can navigate using the up and down arrow keys to view the tiles that are on the next page of the screen.
What’s more, similar to any other report in TallyPrime, you can drill down from any point in the Dashboard to view the values. This helps you analyse data at a deeper level.
- Press Alt+G (Go To) > type or select Dashboard and press Enter.
Alternatively, Gateway of Tally > Dashboard.
- Change Period for the Dashboard.
- Change Period for a specific tile.
- Navigate through the Dashboard in case of many tiles.
- Press Ctrl+Down to move down in the Dashboard.
Alternatively, click the down arrow key located at the bottom-right corner of the Dashboard. - Press Ctrl+Up to move up in the Dashboard.
Alternatively, click the up arrow key located at the top-left corner of the Dashboard.
To know how to add tiles to the Dashboard, refer to the Add/Remove tile section.
- Press Ctrl+Down to move down in the Dashboard.
- Drill down to view further.
- Select a detail in the data or a point in the graph.
- Press Enter.
The report opens.
Was this article helpful?
That’s Great!
Thank you for your feedback
Sorry! We couldn't be helpful
Thank you for your feedback
Feedback sent
We appreciate your effort and will try to fix the article

